Navigating the next normal with data-driven decision making
Written by: Andrew Clark
(View Author Bio)

We are all about measurable results – that implies someone needs to look at data and at least make some observations. And if you are like most people, you fully understand that project data is important, but you wouldn't necessarily spend your free time playing with cluster trees, regression analysis, and PivotTables. Our Decision Sciences team at BI WORLDWIDE (BIW) would like nothing more! The team offers analytical services and solutions to truly understand the impact and potential of our client programs. We go beyond the typical solution and use advanced analytics to provide meaningful insights that allow our clients to optimise their business decisions.
As we try to navigate the next normal, there is growing scrutiny of every action that companies are taking. There are so many influences outside our control and there is no doubt the situation is fluid. However, clearly understanding the current position can help chart the way forward.
You should begin with the end in mind.
In addressing critical business issues, you should begin with the end in mind. What are you really trying to do? What is the business context (problem, opportunity or constraint)? What decisions do you have to make? What data is relevant? And almost always, it comes down to what data is available?
The quality of analysis is dependent on what data is available and the quality of that data. It's important to recognise the need for analytics and insights upfront to determine what analysis will be possible given the available data.
The progression looks something like this:
1. What I already know
Based on my experience, I've learned a thing or two. I've got a lot of insight and it helps guide my decisions and actions.
2. What I need to know
Operational reporting and analysis provides you with insight into what's happening with your program – is it having the desired effect? Can I quickly identify potential areas of concern and fix them before they become real problems?
3. What I want to know
Advanced reporting and analysis gets inside the data to provide insights into why your program is working and what might need to change.
4. What I wish to know
Strategic statistical analysis provides you with insight into the business value of your program and how to maximise it.
And the game-changer even more today:
5. Now that I know…what's next?
Insight in one area often leads to additional questions and a need for more insight. Ongoing, iterative analysis continues to provide new insights as questions evolve.
Why should you care?
A great example of how to use data to drive sales performance is something called audience segmentation. Overall incentives should be designed to achieve a specific result, drive focus, establish priorities, and motivate behaviour. Often, programs are centred on the best salespeople and how to get them to do more.
With audience segmentation, we create different goals for participants and group them based on past performance. With relevant targets derived from baselines, you get lift from all sectors of the salesforce; the top, middle and bottom of the audience. We call it move the middle – motivating the performance of the broader audience, not just top performers.
There is a place for top performer rewards and recognition for sure. Intuitively, we all know about the 80/20 rule. Well, forget that. It's not 80/20; the data tells us that 46% of performance comes from 80% of your team.
By the way, your team knows that the same people win all the time anyway so you need to address this perception as well, but that's another story altogether — it's about communication and inspiration. The reality is that the lift that top performers can bring to your overall results simply isn't large enough against the overall potential of the team all making some improvement.
Without the data and some analysis, you are leaving yourself short.
Another relevant example of using data to determine the real impact of an employee engagement program is to analyse recognition frequency and turnover data to learn if there is an impact on tenure. We all know that turnover is costly and time-consuming. If you are investing in an employee recognition and rewards program, you will likely want to know if there is a return on investment (ROI) on recognition. We hope so, but really we should find out.
When we analysed multiple clients with a sample size of over 30,000 employees, here's what we found out. Turnover is 17.7% less among employees receiving at least one recognition throughout their eligible program tenure. Even in today's challenging environment, you have "mission-critical" employees that you want to retain and they are in high demand. There is a correlation between the frequency of receiving recognitions and turnover.
Employee turnover decreases as frequency of recognitions increases. A 10 percentage point reduction in turnover is seen between Low to High receiving rate. A positive correlation existed between employee turnover and recognition receiving rate, driven almost exclusively by those receiving recognitions with awards. Turnover is 4x higher among employees with the lowest 'recognitions with awards' receiving rates compared to the highest rate of receiving recognition with awards. (Source: BI WORLDWIDE Client Study)
Managers' ability to effectively reward and recognise achievement can increase employees' discretionary effort and intent to stay with an organisation by up to 22.7% and 31.6%, respectively. This results in increased performance and improved retention, thereby improving shareholder return. (Source: Corporate Executive Board)
How about a practical example?
Is it possible to predict an employee's risk of turnover based on his/her recognition frequency?
We investigated the relationship between recognition frequency and employee turnover for potential predictive purposes. Based on the client's annual performance review results, there were high performers in all flight risk deciles. Keep that top talent!
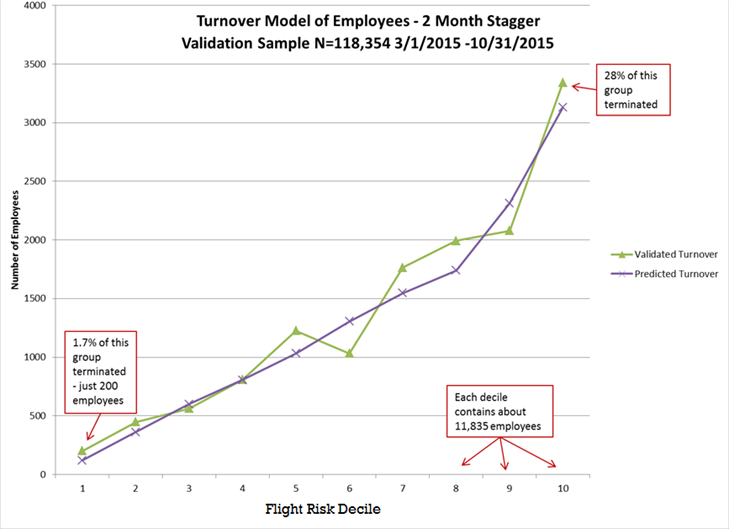
The result: A strong relationship was identified for this client that would allow a fair degree of accuracy in predicting an employee's exit two months before the departure.
When it comes to driving sales performance, likely one of the best examples of data-driven decision making is GoalQuest®, our patented industry-leading incentive rules structure based on baseline performance data, goal selection, and all or nothing performance. It works and we can prove it because we analysed the data.
GoalQuest® relies on a robust database of activity and provides us with the ability to estimate results and ROI before starting the program. As a pay for performance incentive, there is no cost at all if participants don't achieve their goals. How can we do this? We have executed GoalQuest® programs with over 1,150 clients and 1.1M participants. We can predict with a measure of certainty what goals participants will pick and how many of them will achieve their goals to predetermine the ROI.
In the end, we are all accountable to someone. They will ask the question was it worth it and how do you know?
So where do you start?
We all realise there is great potential for valuable insights from data, but many times, we don't know where or how to start. To assist on the journey to discovery, we offer a variety of tools and support to help make the most of your data. Whether it be reports easily accessed from within our participant platforms, or executive-level dashboards created in market-leading data visualisation tools like Tableau, we are passionate about making the most of data.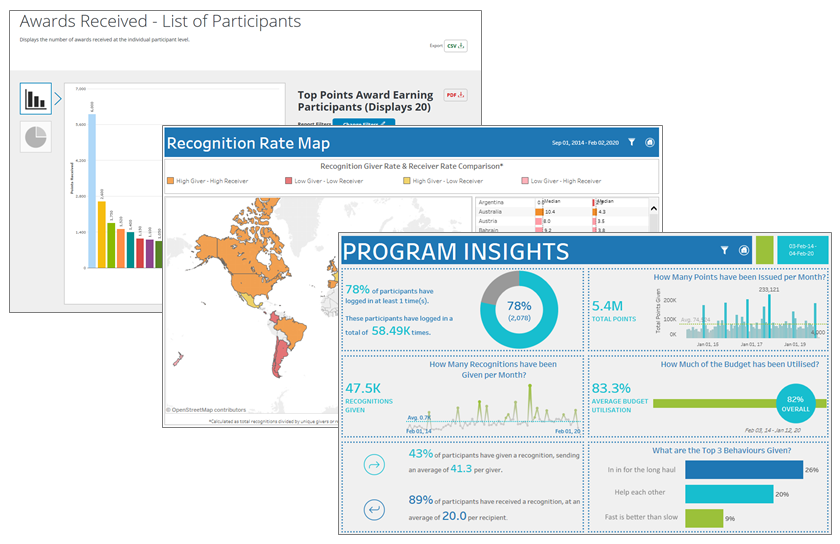
We have built this capability into our DayMaker, SalesMaker, and Channel Smart solutions. The data displayed on the reports should be based on their hierarchy in the program and allow you to segment the data into meaningful insights.
As you evaluate your critical business issues, consider what available data may be used to spur action and lead to results. Whether you are a self-professed data ninja, or you suffer from acute data allergies, reporting and analytics should be an integral part of any solution to monitor progress and drive results. As a company based on producing measurable results, we are passionate about data and we hope you are too.

The best way to get started is to get in touch.


Select a Location:
Choose a region to find relevant solutions and information.


